List of my modules...
Module: Draw_Skeleton
Description:
Displays a skeleton in the viewer, as a set of nodes (points or spheres) connected by lines (or NURBS).
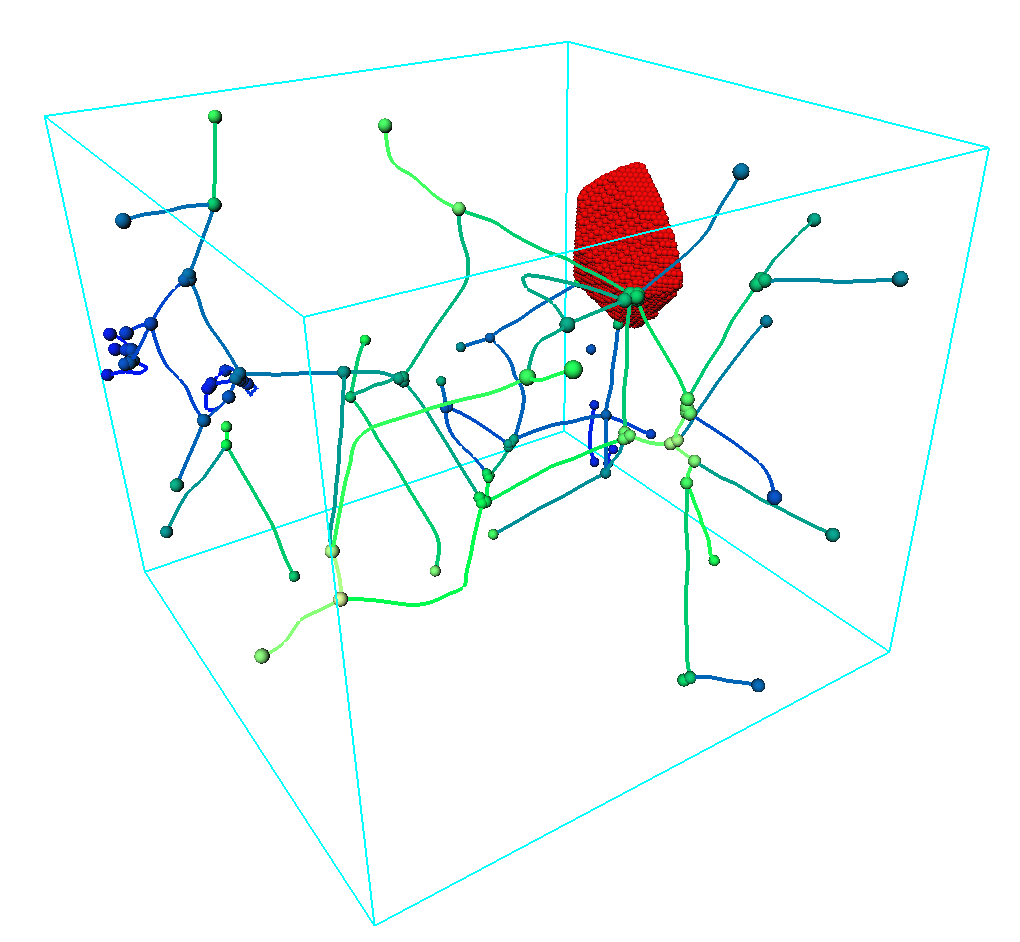
Displaying a skeleton: two instances of this module were used: one for the graph and another for the unclassified points (in red). The nodes and edges are colored according to their associated value.
Connections:
Skeleton
[required]
The skeleton of type HxSkeleton.
Image
An image providing a region of interest as its bounding box. Only the portion of the skeleton inside the bounding box of the image will be drawn. If a cluster has at least one node inside the bounding box, then the entire cluster will be drawn.
Ports:
Draw
What to display. Either the graph or the points (and edges) that have been unclassified.
Node Color

Choice of the colors of the nodes. If a non-constant colormap is chosen, colors are selected according to the nodes' associated values.
Edge Color

Choice of the colors of the edges. If a non-constant colormap is chosen, colors are selected according to the edges' associated values.
Node scale

Size of the nodes.
Edge scale

Size of the edges.
Complexity

Determines the amount of polygons used to draw one sphere that represents a node (when the option to draw spheres instead of points is selected).
Display options

The first toggles draws spheres for the nodes instead of points. The second draws B-splines for the edges instead of lines. The third draws only one sphere/point per cluster, and the fourth colors the nodes (and edges when both extremities are in the same cluster) according to their labels, still using the provided node colormap.
Curve Smoothness

When curves is selected, this port gives the number of middle points to use for drawing the splines. If set to the minimum, then all points of the curve of the skeleton are used. If set to 2, one every two points are used, and so on.
Node Representation

The first option sets the size of the nodes according to their associated value, while the second displays the nodes as wireframed spheres.
GYAAAAAA
Push the first button to display the graph. Push the second to create an Inventor object of what is displayed.
Commands:
Additional options can be accessed when typing in the console Draw_Skeleton COMMAND_NAME. Typing the command again usually reverts back to original settings.
verbose
Displays timing information after the computation. Retype to hide info.