List of my modules...
Module: Histogram_
Description:
Computes a histogram on the greylevels of the image. The histrogram is output to a spreadsheet. Because everyone loves spreadsheets! Especially Matt Parker.
Also has mask and ROI options for computing histogram on only certain voxels of the image. See figure below.
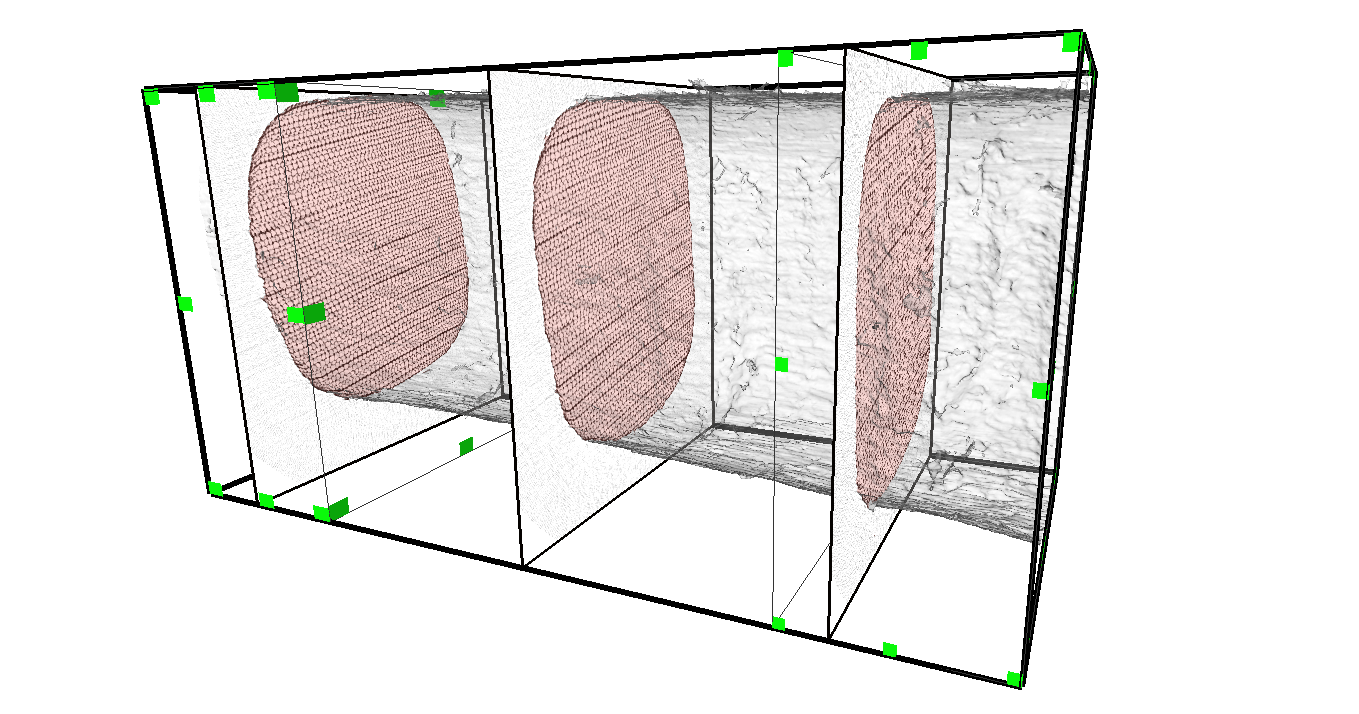
Illustration of a selection process for computing the histogram. The image on which to compute it is shown with the three cross-sections. A mask defines the inside of the imaged sample (a piece of wood in this case), where we want to compute the histogram. A transparent grey surface, as well as the reddish coloring on the cross-sections shows the mask. Finally, two ROIs are defined (boundaries are shown with the green squares), so as to check if the histrogram remains constant all through the sample image (you can imagine a solvent capillary uptake experiment where this could be useful).
NOTES:
- An underscore is appended to the name of the module because Avizo already has a Histogram module.
- This module is a basic encapsulation of a histogram definition (bins) and computation, but with mask and ROI handling. Since it is used in other modules, and likely to evolve, the relevant ports and details are not presented here, but there.
- A mask should be spatially defined in the same way as the input image, i.e. that pixel m(x,y,z) in mask is precisely in the same location than pixel i(x,y,z) in input. The module will check that image dimensions correspond, but will assume that transformation matrix and pixel grid origin and size are equal.
Connections:
Image
[required]
The input image, defined in a class HxUniformScalarField3.
ROI
[optional]
A Region Of Interest (ROI), defined in a HxSelectRoi. Will only count the pixels in the ROI if one is connected. A pixel is defined as in the ROI if the intersection between the ROI and the unit cube that defines the volume occupied by the pixel is non-empty.
Mask
[optional]
A mask image, defined in a class HxUniformScalarField3. Will only count the pixels if the corresponding pixel in the mask satisfies the threshold comparison defined in the appropriate ports.
Ports:
Again, ports and descriptions directly related to the histogram definition and computation are here.
Mask_Threshold

If a mask is connected, this is the value to compare with the mask pixel intensity.
Mask_Comparison
If a mask is connected, defines how the mask threshold is used to define the pixels to count: should the pixel value be lower, lower or equal, greater, etc. than the mask threshold?
Compute
Push the button to compute the histogram.
Commands:
Additional options can be accessed when typing in the console Histogram_ COMMAND_NAME.
verbose
Displays timing information after the computation. Retype to hide info.
create
Runs the computation. Returns the name of the output, so it can be used in a script, such as set RESULT [Histogram_ create].