List of my modules...
Module: Rose_Diagram
Description:
From a centred 3D autocorrelation function, computed with the Autocorrelation module, displays or extracts data as a function of distance from the origin. The rose diagram displays values of autocorrelation at a given distance or distance interval in all directions (of course, there's a central symmetry in the autocorrelation function, so an eighth of the rose contains all the information). The plot option provides a spreadsheet with value characteristics as a function of distance and of direction.
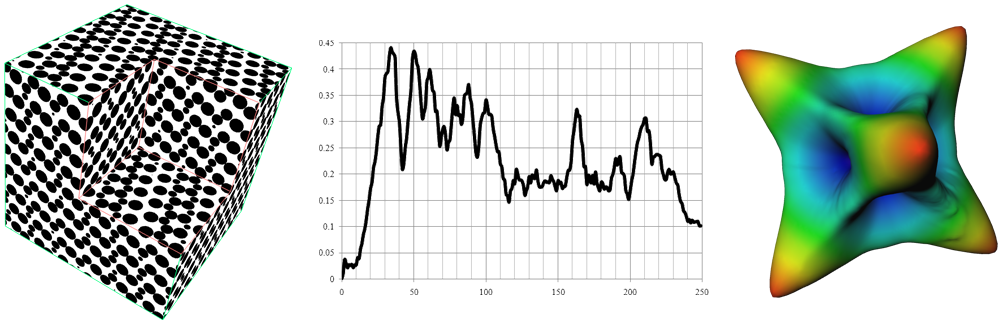
From left to right: an image of a cubic packing of balls, on which the autocorrelation is computed; the plot of average correlation as a function of distance; the resulting rose diagram, indicating the orientation of the packing.
Connections:
Image
[required]
The autocorrelation, an instance of HxUniformScalarField3.
Ports:
Computation

The first and second options are used only to draw the rose diagram. The first option, On sphere, uses the values at a given distance from the center, i.e. 0-autocorrelation (the values are taken at the vertices of a triangulated sphere). The resulting rose is first shaped as a sphere, with the same radius, but each vertex is moved closer or further away according to the autocorrelation value (higher means stretched further). Colouring can be applied to the vertices, also according to autocorrelation value.
The second option, Integration, integrates the autocorrelation value over a given range. This allows to smooth over staircase artifacts from the cubic grid.
The last option, Spreadsheet, creates a spreadsheet with 2 tables :
- f(Radius): characteristics as a function of radius. Columns are: Radius (in pixels), Min (the minimum correlation value found at said radius), Max (the maxium), Mean (the average correlation at said radius), MaxDev (the maximum deviation from the mean, i.e. abs(value-mean)). If the Direction option is set, another column called ac(x,y,z), where x,y,z most closely resembles the given direction, lists the autocorrelation values in that direction at said radius.
- f(Direction): characteristics as a function of direction. Columns are: x,y,z (the unit direction vector), Min_ac (minimum correlation in said direction), rMin_ac (radius at which minimum correlation was found), rZero (smallest radius at which correlation is negative, -1.0 if correlation in said direction never dips below 0), Max_avg_diff (maximum difference from the average correlation for each radius, i.e. argmaxr ac(r,dir)-avg(r), rMax_avg_diff (radius at which said max difference was found), Min_avg_diff (minimum difference from average), rMin_avg_diff (radius at which said minimum difference was found).
If debug is set, this option also creates a point set showing all the positions where correlation values are taken. Each point has three data columns: time (step number, increasing with sphere radius), vertex (direction index), and intensity (correlation value).
Finally, the rose diagram that is drawn is coloured according to the value of the minimum autocorrelation and vertices are positioned where the corresponding radius was found.
Draw_style

Wire frames, surfaces or both for the cubes ?
Line_width

Width of the lines, if wire frame is selected in Draw_style.
Point_size

Size of the points, if points are selected in Draw_style.
Subdivisions

Number of vertices on the triangulated sphere.
Radius

Distance at which the correlations are extracted, for the "On sphere" option in Computation.
Min_radius

Minima of the radius interval for the "Integration" option in Computation.
Max_radius

Maxima of the radius interval for the "Integration" option in Computation.
Scale

Amount of deformation of the resulting sphere to produce the rose, i.e. more shrinkage where values are low and more dilation where values are large.
Colormap

Colours used for the rose.
Options

The first option automatically adjust the range of the colourmap to match the range of extracted values.
The second option is only useful for the Spreadsheet option. The spreadsheet contains autocorrelation values characteristics that were sampled at regular distance interval. By default, this value is 1, i.e. the size of a pixel. This option allows sampling more than once per pixel, for a more accurate result.
Sampling

With the Supersampling option from the previous port set, this provides the number of samples per pixel length to take.
Now

Push the first button to run the computation. The second button creates an Open Inventor data object of the rose. The third button erases the displayed rose.
Commands:
Additional options can be accessed when typing in the console Rose_Diagram COMMAND_NAME.
create
Runs the computation. Returns the name of the output, so it can be used in a script, such as set RESULT [Rose_Diagram create].
smooth
Smoothes the lighting on the rose diagram so you don't see the triangles. Typing the command again reverts back.
setRandSeed [X]
The mesh of the diagram is assigned a random rotation at the start, so that the vertices are never exactly along the system axes, nor in the same position. This command sets the seed generator to an integer X for the random rotation. Once set, all subsequent computations of the module will use the same rotation. If no X is given, the seed is reset at every computation.
randRotation
Toggles the aforementioned rotation. Default is on.