List of my modules...
Module: Create_Sphere_Pack_Image
Description:
Creates an image representing a sphere packing. Additionally can output others structures, most notably a graph representing the contacts between the spheres.
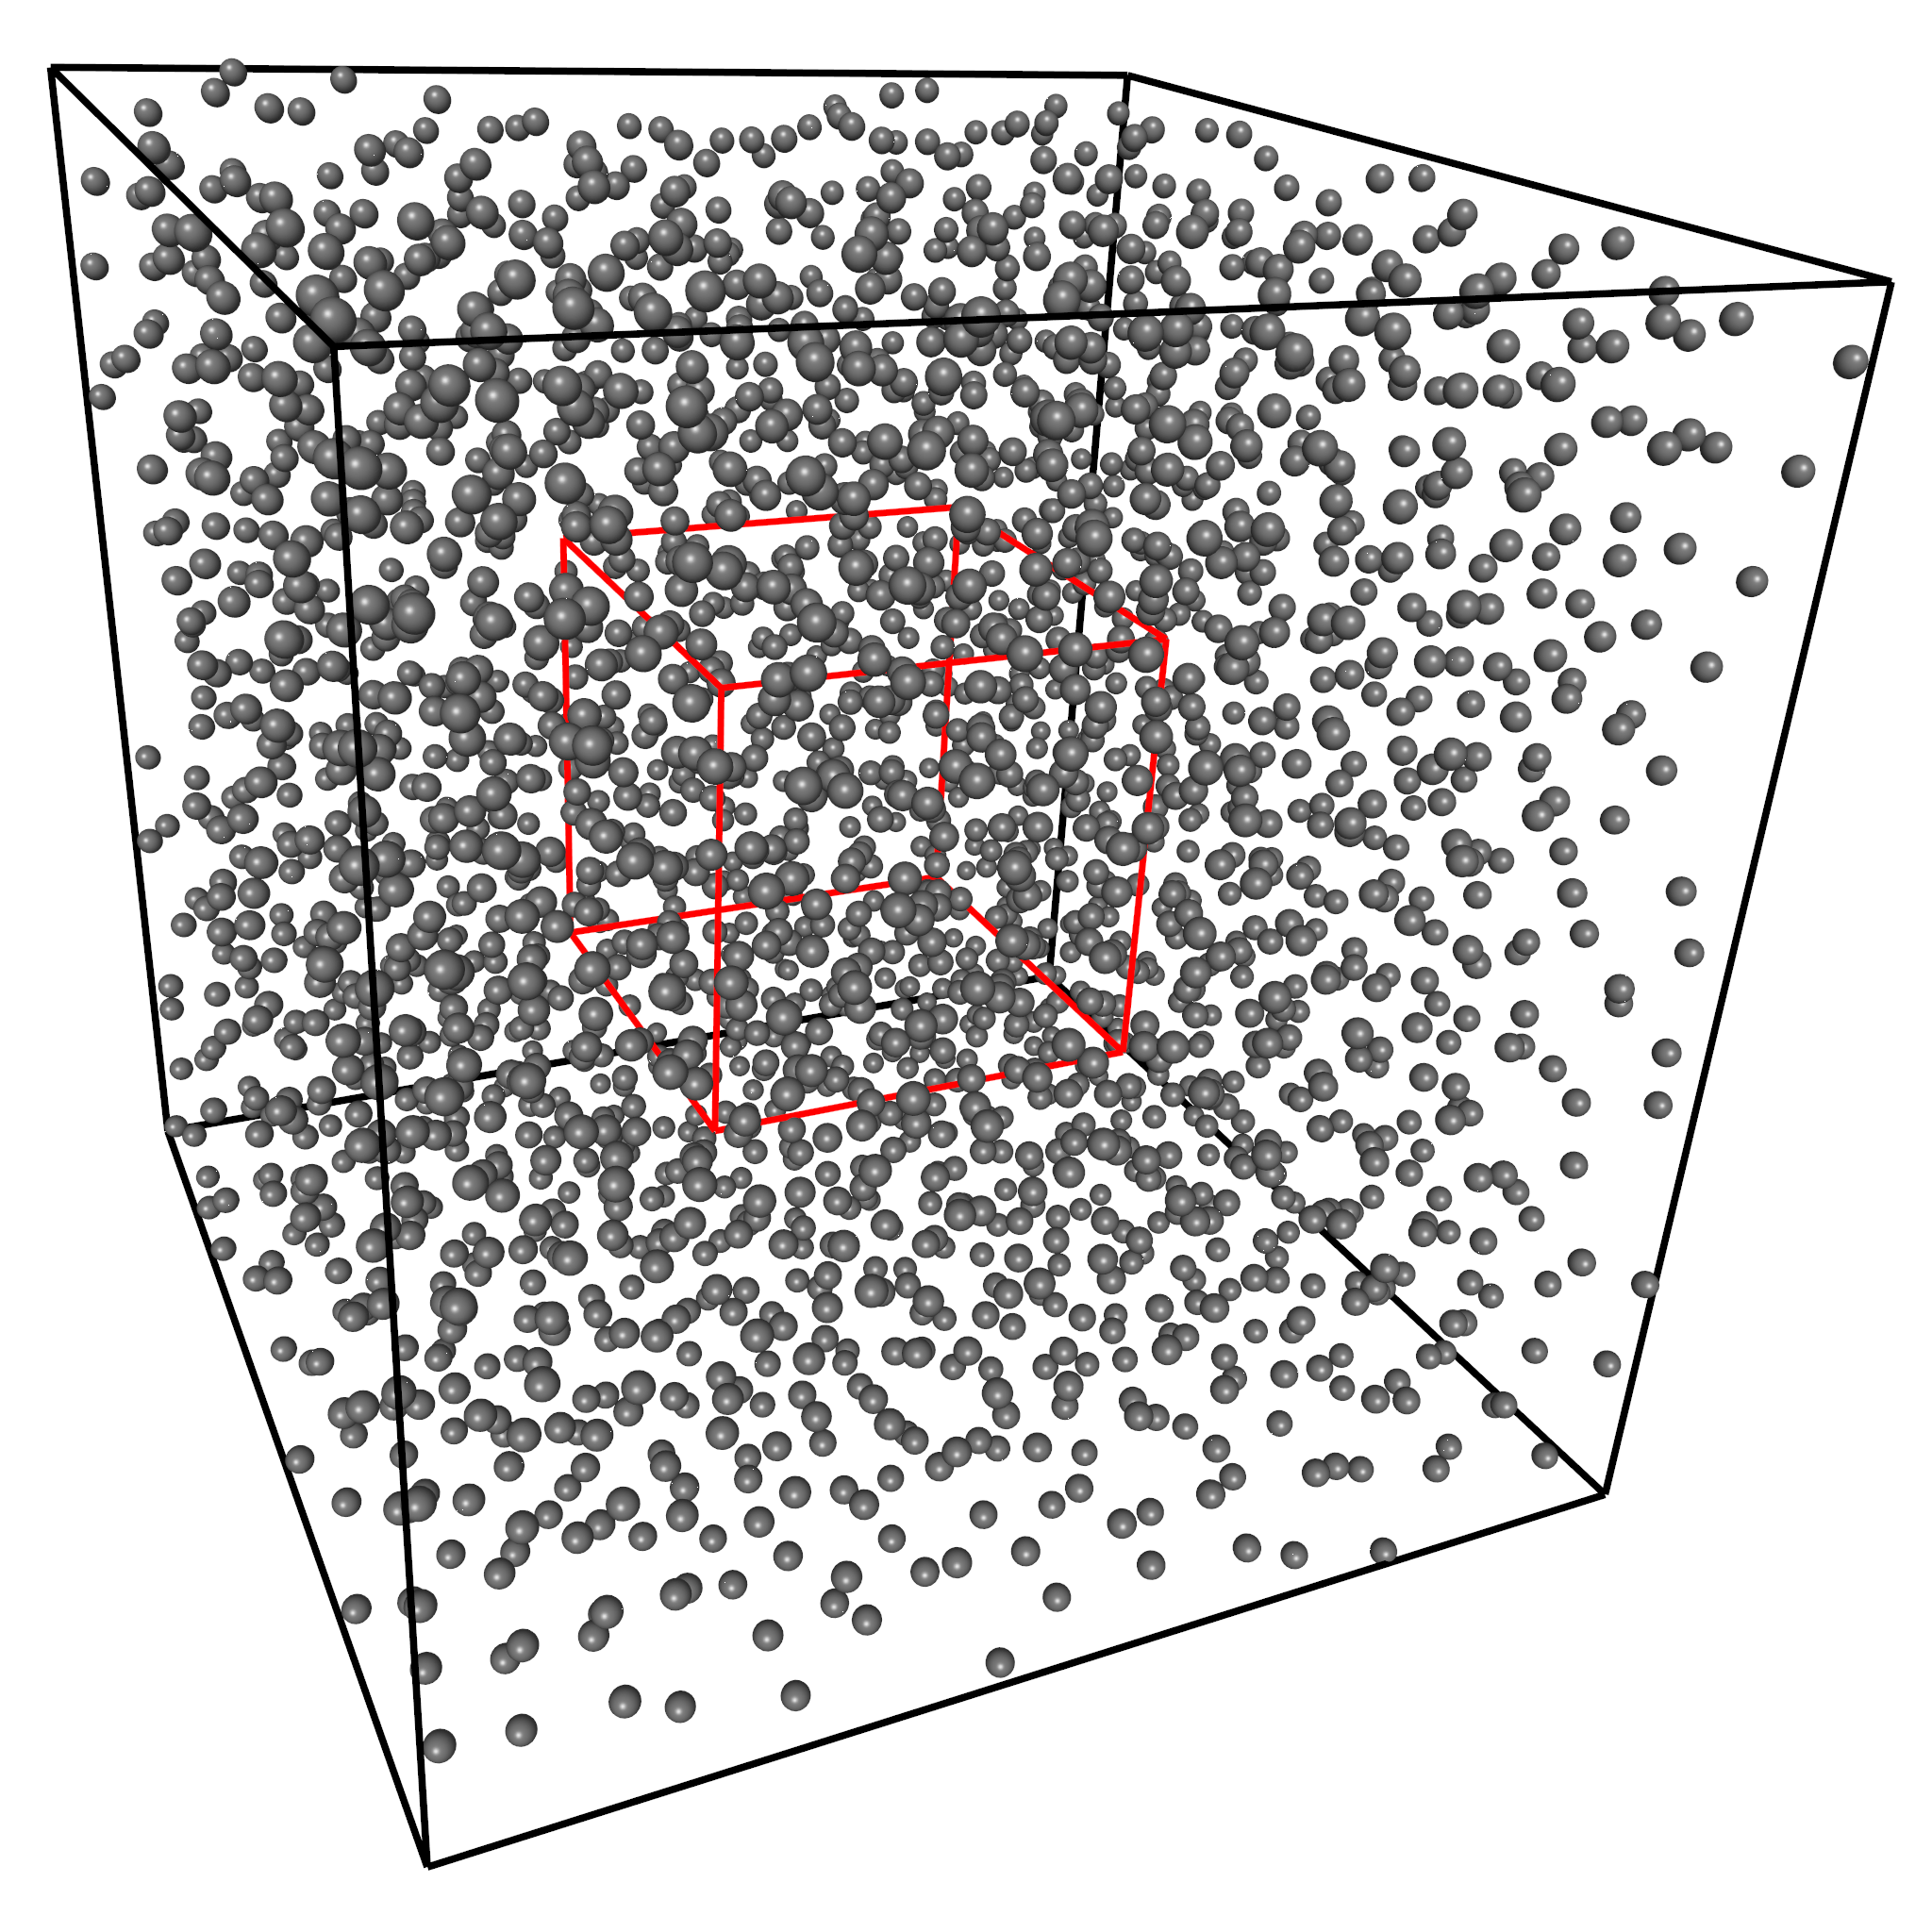
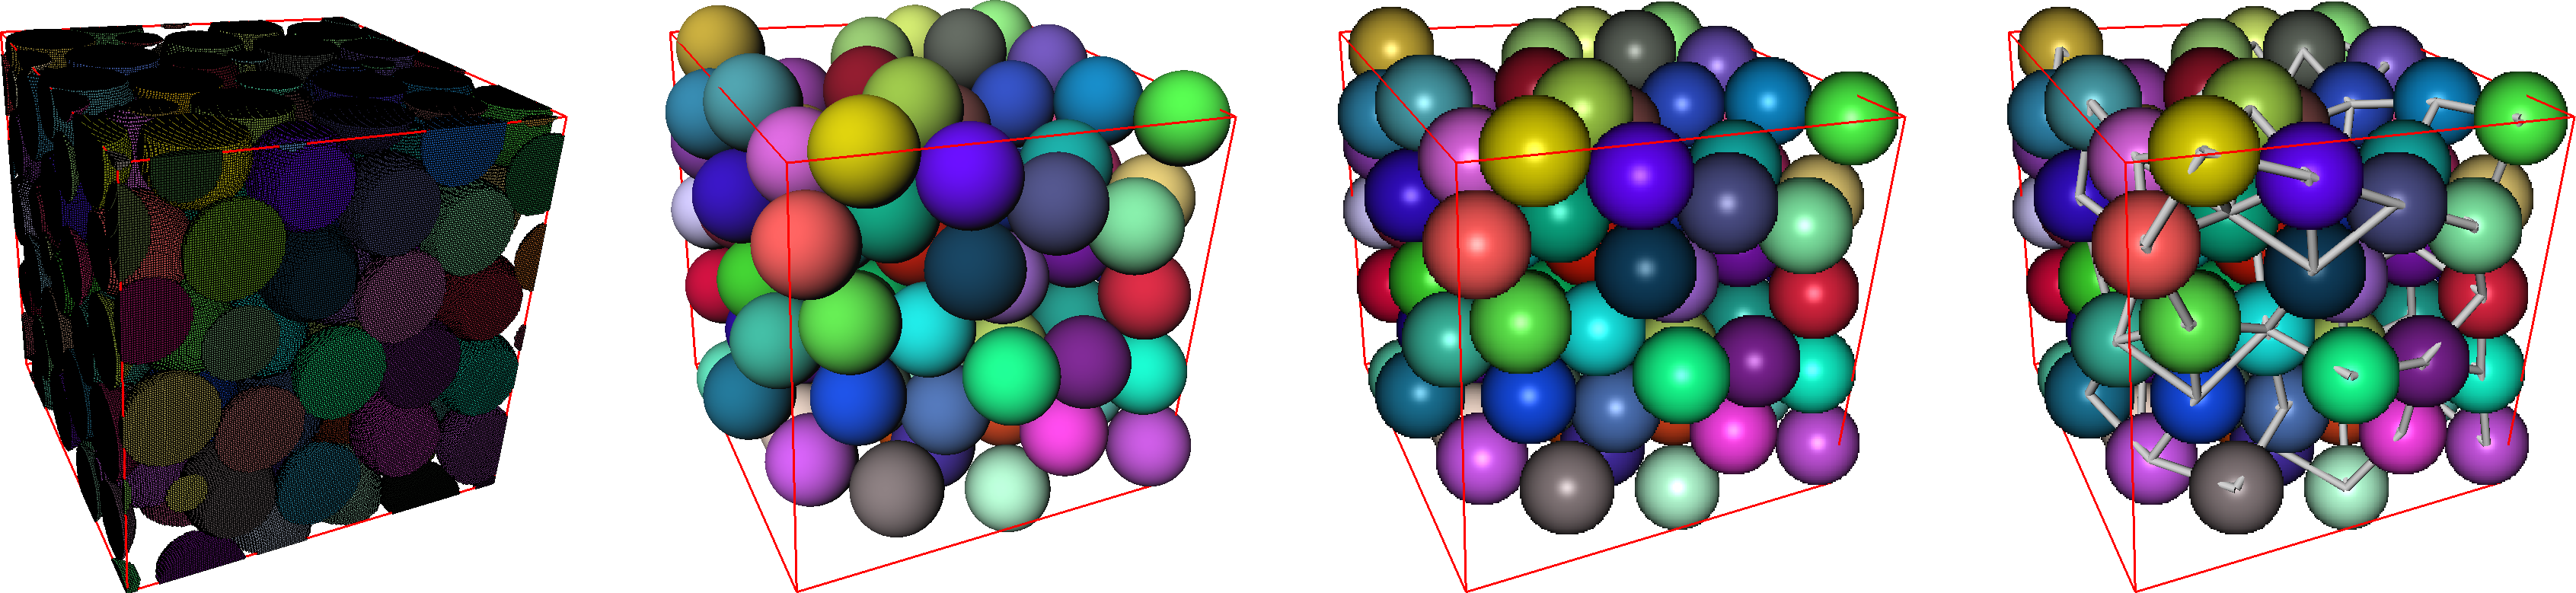
Illustration of the outputs. The top image shows the input point set, representing a sphere pack. The red cube in the center shows the desired bounding box of the output. The bottom line shows the four types of outputs generated. From left to right : image, inventor object, point set, and contact graph.
Connections:
Image
[required]
Image spheres, stored in a HxCluster, with the first data column storing the sphere radii. If the data contains parameters named Box and Origin (as triplets of integers), then they will automatically fill the fields in the corresponding ports.
Ports:
Radius factor

Each radius is multiplied by this factor before the image is generated.
Discretisation

Algorithm used to generate the image. The simplest and quickest algorithm is Point: each pixel is considered as a points, and is assigned to a sphere if the point is at a distance less than the sphere radius. If it is inside several spheres, then it is assigned the one with the closest centre. If Cube is selected, then a pixel is assigned to a sphere only if its entire volume is inside that sphere. Again, if this applies to multiple spheres, then the closest one is chosen.
If Volume is selected, then a pixel is considered a unit cube, and the overlapping volume between it and the sphere is calculated. If the total overlapping volumes (there can be more than 1 sphere intersecting the cube) exceeds 50%, then it is assigned a sphere, whose choice depends on where the cube centre lies according to the plane defined by the intersections of the two spheres (i.e. a circle). This is by far the most time-consuming, and because of the stochastic manner in which the overlapping volume is calculated, the results are non-deterministic.
Accuracy

If Volume is selected from the Discretisation port, the overlapping volume is calculated by generating a certain number of points, set by this port, randomly in the cube representing the pixel and checking whether it's in the sphere or not. The number of points inside the sphere divided by the total number of points approximates the overlap percentage.
Output

Output type. The module is designed to output an image, but it can also generated an inventor object, for visualisation purposes. It can also output a point set, of the same type as the input, but with only with the spheres that intersect the bounding box. Finally it can also output a graph representing the contact between the spheres.
Box origin

Front top left corner of the bounding box of the output. Only useful to modify if a subvolume of the sphere packing is desired.
Box size

Size of the bounding box of the output. Only useful to modify if a subvolume of the sphere packing is desired.
Pixels

Size, in pixels, of the output image.
Contact_Delta

When a sphere pack is generated, the typical algorithm makes it so that there is no intersection between the analytical spheres, and just two are in perfect contact. Therefore a delta can be given to avoid the graph having only one edge. :)
Note that the radius factor is also taken into account when generating the edges of the graph. The condition for creating an edge between spheres x and y, given respective centers and radii (cx,rx) and (cy,ry), the radius factor rf, and the contact delta d, is :
dist(cx,cy) ≤ rf*rx + rf*ry + d
Options
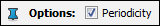
To use for periodic boundary conditions. A sphere near the image border will not be cut at the boundary, but the rest of the sphere will ba found on the other side of the image. When a cluster output is asked, a new data column b is added to define if the sphere is in contact with the border, and to tell you which ones have been added on the outside of the bounding box to represent this periodicity.
Action
Generates the output.
Colors

Color for each sphere in the inventor object. The color taken from the colormap is the one at the value equal to the point id in the input cluster. For a good colormap in this case, see Create_Colormap.
Commands:
Additional options can be accessed when typing in the console Count_Pixels COMMAND_NAME.
setComplexity
Specifies the number of triangles used to display the spheres as an inventor object. Ranges between 0 (crude) to 1 (very fine).
verbose
Displays some information on the computation. Retype to hide info.
create
Runs the computation. Returns the name of the output, so it can be used in a script, such as set RESULT [Create_Sphere_Pack_Image create].